
What is BigCharts?
BigCharts is a comprehensive financial tool offering real-time and historical market data, advanced charting capabilities, and insightful analysis. It caters to investors and traders seeking detailed information to make informed decisions in the dynamic world of finance.
Why Choose BigCharts?
BigCharts is the ideal choice for those who prefer functional simplicity over complex, cluttered modern interfaces. It is chosen for its "no-nonsense" approach, offering lightning-fast chart generation and a legendary historical database. It remains a go-to for investors who need quick, printable reports and reliable technical indicators without subscriptions.
Benefits
Accessibility: Completely free to use with no account or registration required.
Speed: Light-weight website architecture ensures charts load rapidly even on slower connections.
Accuracy: Powered by MarketWatch/Dow Jones data, ensuring high-quality, professional information.
Simplicity: Offers a clean, "no-frills" interface that focuses on data visualization rather than social features or complex UI.
Reliability: One of the most stable financial tools on the web, with a massive historical database dating back to 1985.
Features
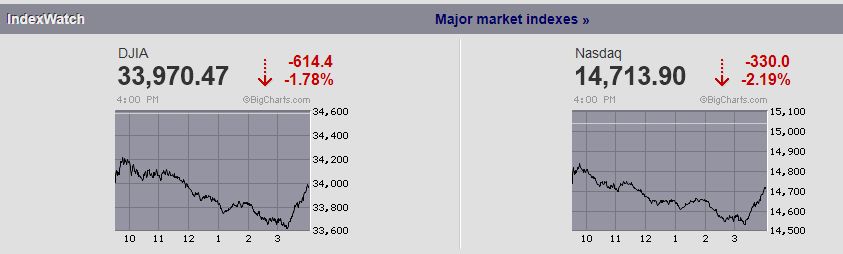
Interactive Charting: Customize timeframes (intraday to decades) and chart types (Candlestick, Bar, Mountain).
Technical Indicators: Access to over 30 overlays including Moving Averages, RSI, and Bollinger Bands.
Historical Quotes: A specialized tool to find the exact closing price of any security on a specific past date.
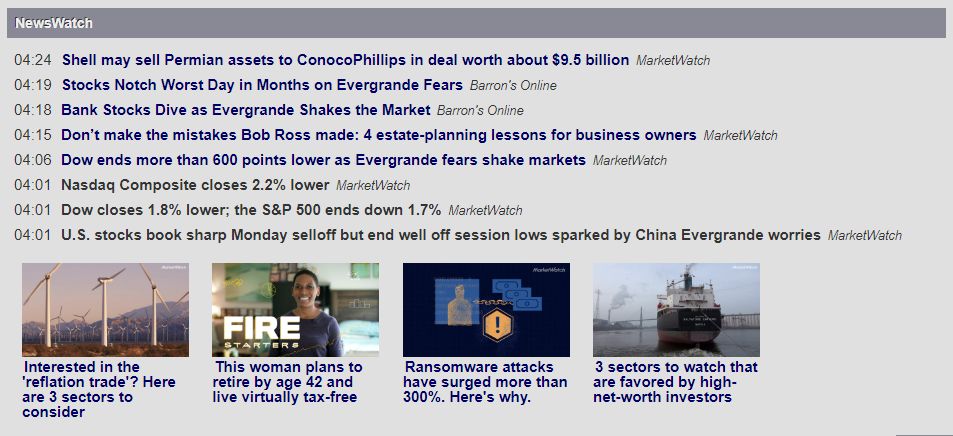
Market Analysis: Dedicated sections for industry performance, stock screeners, and market "pulse" summaries.
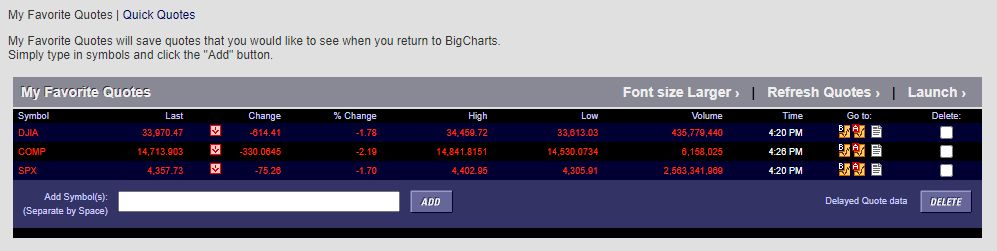
Customization: Users can save chart settings and styles to a browser via cookies for quick future access.
Pricing
Free Version: The core BigCharts service is $0 (100% free) and supported by advertising.
Advanced Data: While BigCharts itself is free, it is integrated with the MarketWatch ecosystem. Users seeking real-time (non-delayed) data or premium news may occasionally see subscription offers for MarketWatch (starting around $2/month for basic tiers in 2026).
No Hidden Fees: There are no "paywalls" for specific technical indicators or historical data within the BigCharts site.
Demo
Instant Access: There is no "trial" needed; the live site serves as its own demo.
Getting Started: Simply visit the homepage and type a ticker (e.g.,
NVDAorAAPL) into the search box.Interactive Controls: Click "Interactive Chart" on the left sidebar to open the full suite of tools. From there, you can toggle indicators on/off and watch the chart update in real-time.
BigReports: Explore the "Industries" tab to see a live demo of how the tool clusters and compares sector performance.
Contact us to get detailed pricing as per your requirements.
No reviews yet. Be the first to review!
BigCharts does not currently offer a free trial.
BigCharts provides Phone,Email,Live Chat,Online (Ticket) support.
BigCharts is Cloud Hosted software.
BigCharts provides Help Guides,Video Guides,Blogs,Webinars,Case Studies for training.


