
ThoughtSpot

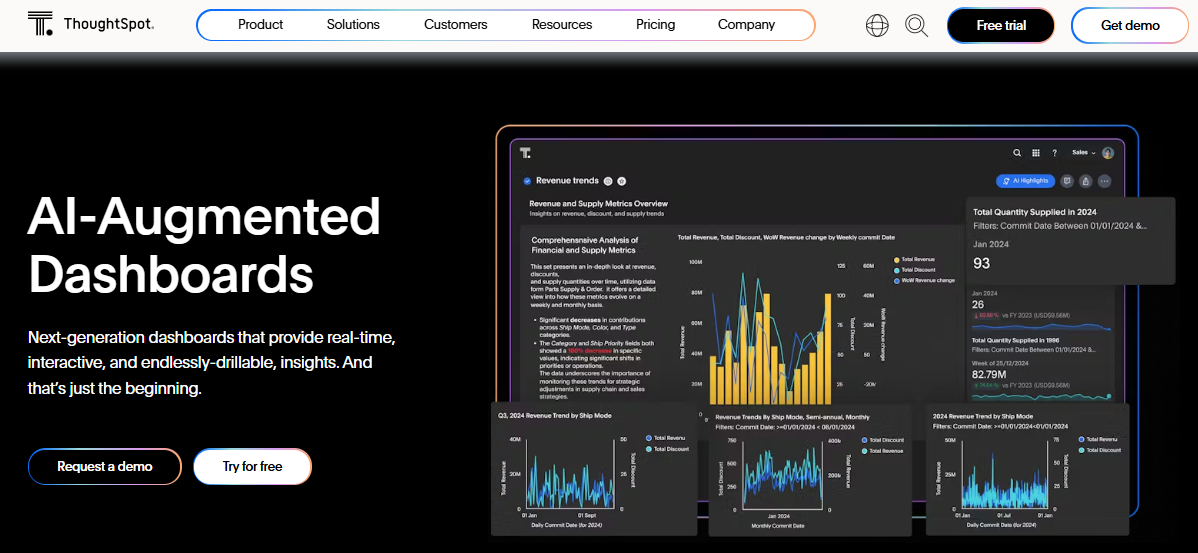
Next-generation dashboards that provide real-time interactive and endlessly-drillable insights. And that’s just the beginning.
ThoughtSpot Visualize™ is a powerful data visualization and exploration component of the ThoughtSpot analytics platform. It empowers business users, analysts, and developers to create rich, interactive data visualizations without relying on coding or complex BI tools. With an intuitive drag-and-drop interface and AI-driven insight recommendations, it allows users to explore data dynamically, uncover hidden trends, and present their findings through engaging dashboards and visual stories.
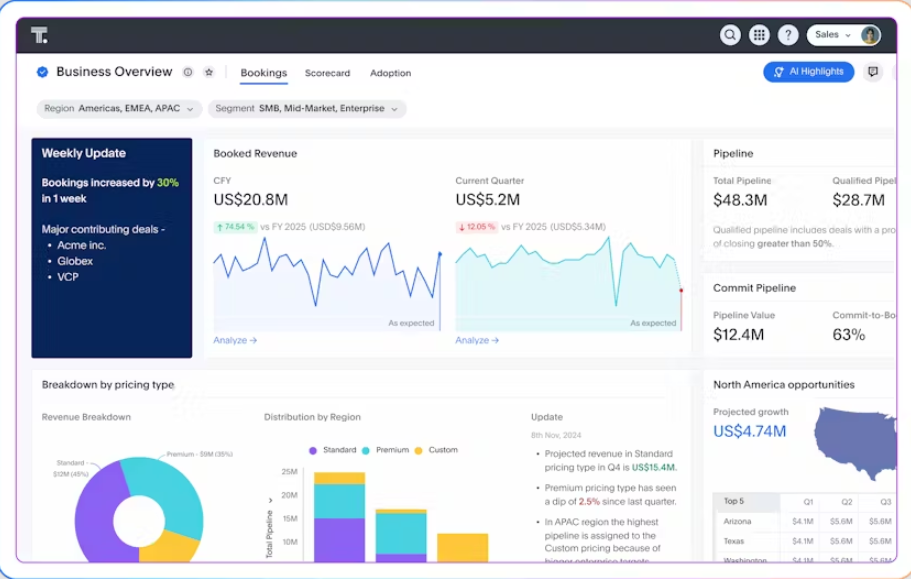
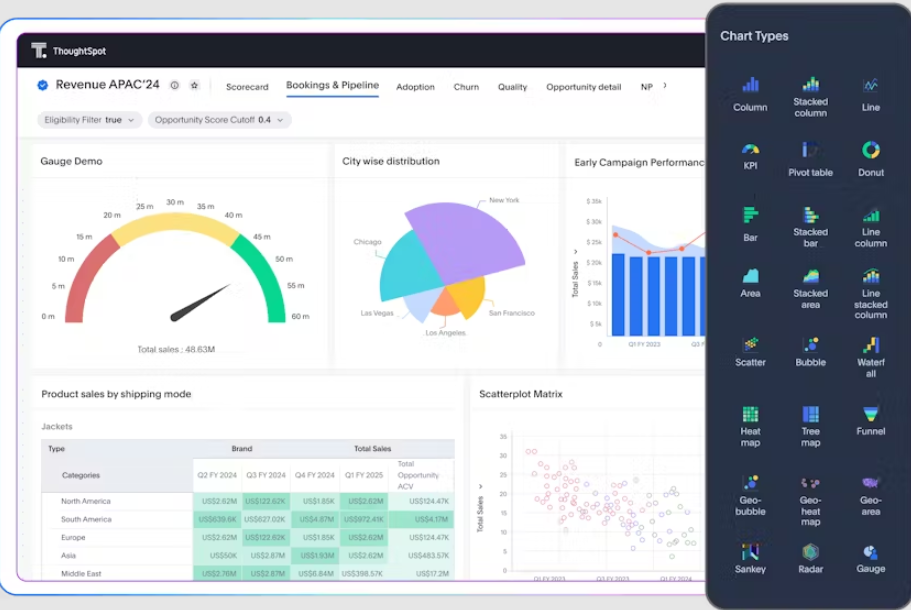
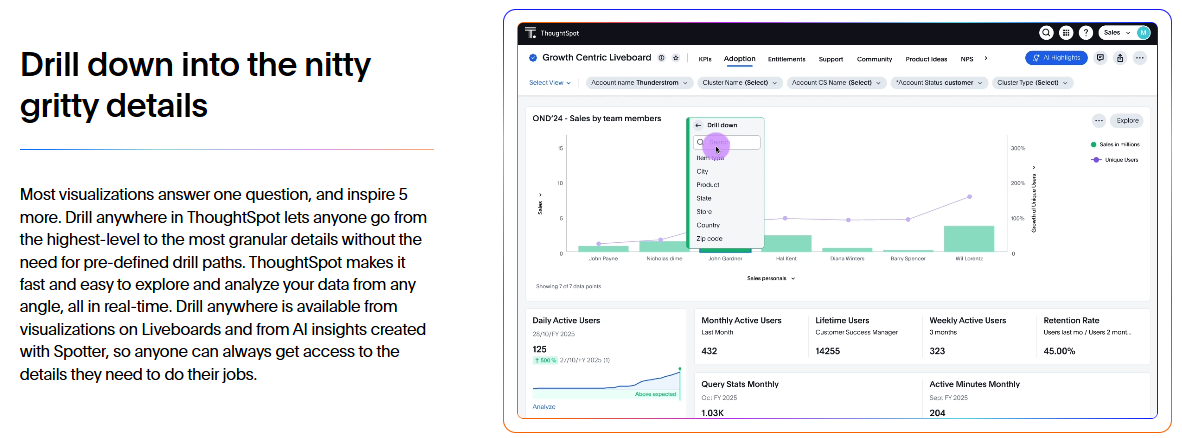
Visualize supports over 25 built-in chart types including bar, line, scatter, heatmaps, treemaps, waterfall, KPI cards, geo maps, and Sankey diagrams. These visualizations can be created via Quick Charts or the Visual Explorer, offering different levels of customization based on user needs. Users can drill into data directly, apply filters, and set up live alerts based on KPIs to stay updated in real-time.
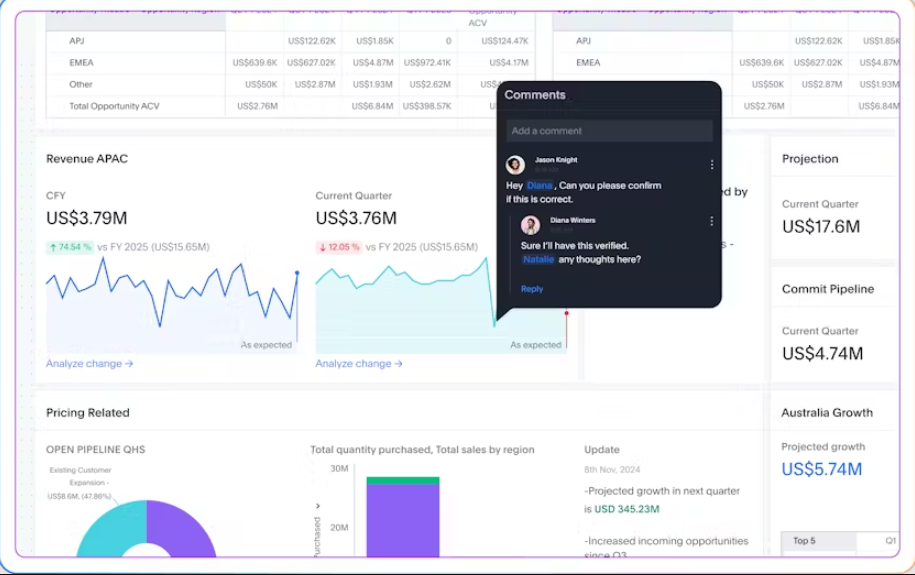
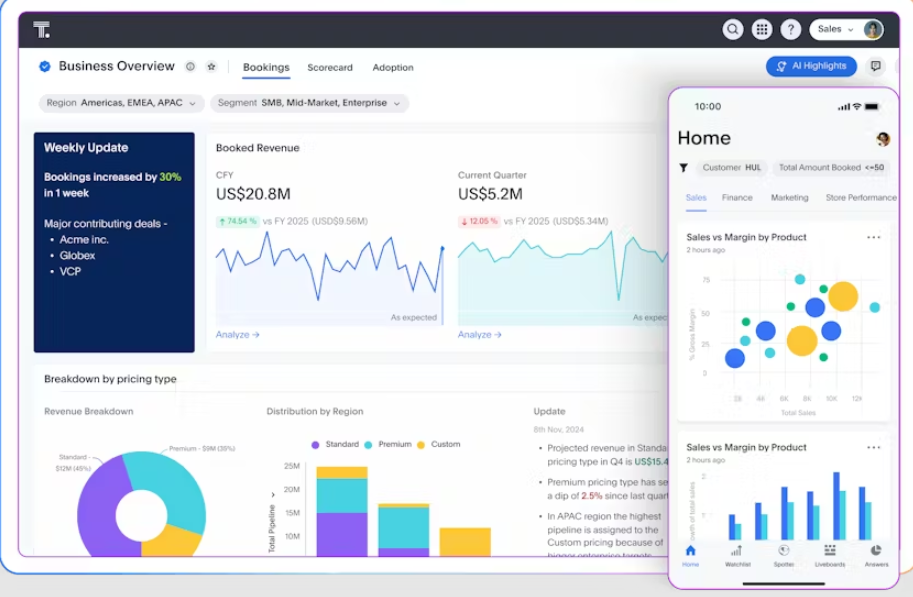
Its tight integration with ThoughtSpot’s Liveboards enables seamless collaboration, while the embedding capabilities via ThoughtSpot Everywhere allow organizations to integrate visuals into external applications. With support for calculated fields, pivot tables, and advanced developer tools, ThoughtSpot Visualize™ helps convert raw data into clear, actionable insights that drive smarter decisions across industries such as retail, finance, healthcare, and technology.
ThoughtSpot Visualize™ is a next-generation data visualization solution designed to make data insights instantly accessible to anyone. Built on top of the ThoughtSpot platform, it enables users to build interactive and highly customizable visualizations directly from live cloud data. The platform focuses on making data analytics both visually rich and easy to explore, offering tools for real-time visual analysis and collaborative decision-making.
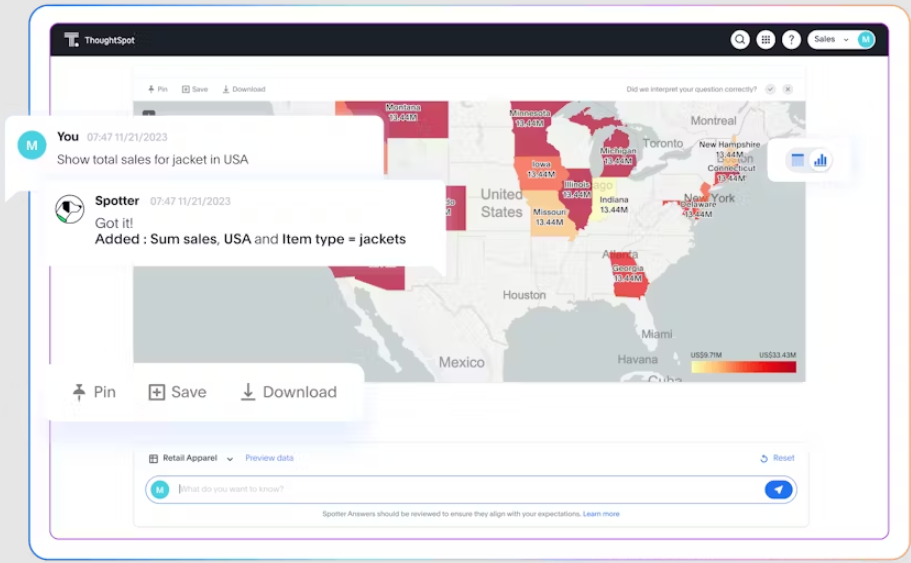
Visualize includes two main creation modes: Quick Charts for rapid visualization from keyword-based searches, and Visual Explorer, a flexible workspace inspired by grammar-of-graphics that supports advanced data layering and customization. Users can build charts from scratch by dragging dimensions and measures onto visual canvases, selecting chart types, and customizing appearance with filters, legends, labels, and colors.
More than 25 built-in chart types are available, including bar, line, area, pie, treemap, waterfall, geo maps, heatmaps, scatter plots, and Sankey diagrams. Visuals are interactive, allowing users to drill down into data, pivot by different variables, and apply real-time filters. Users can also set up alerts (Watchlists) to get notified when KPIs change, with alerts delivered via email, mobile, Slack, or Teams.
ThoughtSpot Visualize™ integrates seamlessly with the broader ThoughtSpot ecosystem, including Liveboards for dynamic dashboards and ThoughtSpot Everywhere for embedding visuals into web apps or internal tools. Developers can build custom visualizations using JavaScript or leverage REST APIs to connect to external systems. Business analysts benefit from features like calculated fields, conditional formatting, and real-time query responses from cloud data warehouses.
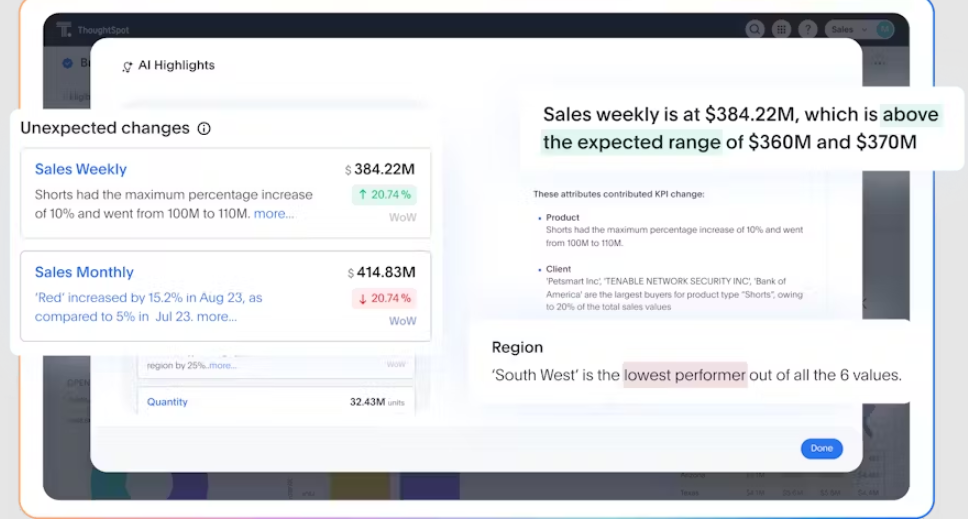
Designed for enterprises across industries, ThoughtSpot Visualize™ offers a scalable solution that blends user-friendliness with deep analytical power. Its AI-enhanced backend also recommends insights based on data patterns, empowering teams to discover trends and take action quickly. The result is a more engaged and data-driven organization that can react swiftly to evolving business needs.
Key Features:
-
25+ native chart types (bar, line, scatter, heatmap, treemap, Sankey, KPI, geo maps)
-
Quick Charts for instant visual generation
-
Visual Explorer with drag-and-drop interface and grammar-of-graphics structure
-
Drill-down and interactive filters
-
Customizable labels, legends, axes, tooltips, and color schemes
-
Calculated fields and pivot tables
-
Alerts and Watchlists with email/Slack/Teams integration
-
Collaboration via Liveboards (interactive dashboards)
-
Developer tools (REST APIs, SDKs, JavaScript customization)
-
Embedding support via ThoughtSpot Everywhere
- ✓ Visual Analytics
- ✓ Public Dashboard
- ✓ Private Dashboard
- ✓ Interactive Dashboard
- ✓ Profitability Analysis
- ✓ Ad hoc Reports
- ✓ Data Analysis
- ✓ Interactive Dashboard
- ✓ Master Data Management
- ✓ Data Analysis
Contact us to get detailed pricing as per your requirements.
No reviews yet. Be the first to review!
ThoughtSpot is a Dashboard Software solution. Top features include:
- Visual Analytics
- Public Dashboard
- Private Dashboard
- Interactive Dashboard
- Profitability Analysis
ThoughtSpot does not currently offer a free trial.
ThoughtSpot provides Phone,Email,Live Chat support.
ThoughtSpot is Cloud Hosted,Hybrid,Any software.
ThoughtSpot provides Help Guides,Video Guides,Blogs,Webinars,Case Studies,Whitepapers for training.


