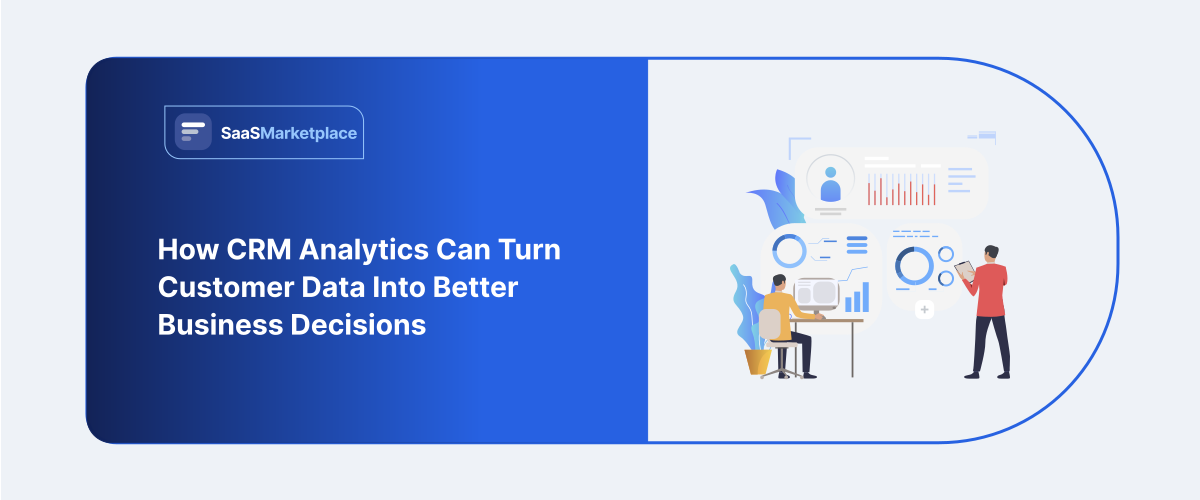
How CRM Analytics Can Turn Customer Data Into Better Business Decisions
-min.jpg)
Contemporary business enterprises capture immense quantities of structured buyer information throughout daily operational cycles. While central management databases excel at logging standard transactional timelines, basic internal summaries frequently fail to provide the deep, multi-dimensional clarity required for strategic institutional expansion. Overcoming these baseline reporting boundaries requires the systematic deployment of advanced CRM analytics across the entire corporate structure. This sophisticated evaluative framework allows executive boards to transform fragmented data points into cohesive, actionable directives, minimizing administrative friction while uncovering hidden revenue generation channels. Transitioning toward an elite analytical model ensures that corporate resource investments yield highly predictable financial returns.
 Looking for CRM Software? Check out SaaS Marketplace List of the Best CRM Software in USA for Your Business
 Why CRM Data Needs a Deeper Analytical Layer
1. The volume of customer information businesses collect
Modern commercial operations generate millions of raw customer interactions across multiple digital storefronts, email networks, and support desks daily. This continuous influx populates central repositories with a massive volume of unstructured customer data that scales faster than standard team analysis capacity.
2. Problems with relying on basic CRM reports
Standard out-of-the-box system summaries typically focus on flat, historical tallies that offer a very shallow view of operational reality. Relying exclusively on basic sales reports prevents operations leaders from understanding the true underlying behavioral mechanics that drive buyer conversions.
3. Turning raw records into meaningful business intelligence
Transforming transactional logs into high-value strategic execution material requires a rigorous commitment to advanced algorithmic synthesis. Specialized analytical layers dissect granular engagement parameters, establishing verified behavioral profiles through deep, systematic data analysis. This synthesis translates isolated operational events into broad, high-impact business intelligence that directly influences long-term corporate positioning.
4. Moving from historical reporting to actionable insights
Prudent corporate governance demands transitioning away from simply documenting past failures or achievements toward predicting future market opportunities. Advanced CRM reporting methodologies utilize historical data streams to build predictive performance templates, enabling real-time risk mitigation. Isolating specific drop-off patterns allows operations managers to implement preventive adjustments before minor funnel friction degrades annual conversion targets.
What Can You Learn From Your CRM Data?
Sales performance
Deep mathematical evaluation of historical team outputs reveals the true drivers of operational throughput across the firm. Analytical layers isolate individual representative strengths, compare multi-regional conversion timelines, and measure exact quote-to-cash velocity metrics with high statistical precision. Utilizing detailed sales analytics helps enablement directors design data-backed training structures, eliminating floor inefficiencies systematically.
Lead quality
Sustaining premium organizational momentum requires a continuous, data-driven audit of incoming pipeline prospects to isolate highest-value conversion channels. Statistical assessment maps original marketing attribution touchpoints against long-term contract value parameters to calculate precise acquisition returns. Incorporating specialized Retail Accounting Software during late-stage pipeline conversions automates the calculation of exact client margins, showing which lead paths generate real profitability versus empty volume.
Customer behavior
Analyzing digital footprints across multiple communication channels provides corporations with an unfiltered view of buyer preferences. Advanced modeling traces product usage spikes, communication frequencies, and contract renewal timelines to isolate implicit satisfaction indicators. Understanding these behavioral patterns allows marketing departments to position contextual upgrades exactly when client interest peaks.
Pipeline health
Evaluating total operational inventory requires a strict, automated inspection of active opportunities across the corporate ecosystem. Continuous pipeline analysis monitors total open contract values, check stage distributions, and calculates historical progress probabilities mathematically. This oversight prevents sales directors from resting on inflated, static pipelines that house stagnant opportunities.
Conversion rates
Tracking the exact percentage of prospects that progress through sequential operational boundaries reveals the true efficiency of current sales tactics. Managers must analyze conversion metrics across distinct vertical industries, separate product tiers, and regional territories simultaneously. Pinpointing precise locations where prospects stall helps design targeted internal adjustments, maximizing aggregate deal velocity.
Revenue trends
Long-term corporate health depends on identifying macro-financial movements early through rigorous tracking of recurring contract values. Analytical frameworks calculate compounding annual growth rates, monitor expansion percentages, and trace seasonal demand variations systematically. Grounding financial projections in historical trend lines shields the organization from sudden macroeconomic corrections.
Customer retention
Fulfilling basic transaction goals yields minimal business value if the organization experiences a high rate of client churn post-onboarding. Tracking contract renewals through detailed cohort analysis allows data analysts to measure retention stability across specific activation timeframes. Identifying precise monthly usage patterns that correspond to long-term loyalty helps refine onboarding workflows.
Connect CRM Data With Business Analytics
Combining CRM information with other business data
Isolating customer records from external financial ledgers, inventory databases, and logistical shipping logs limits structural visibility. True operational dominance belongs to organizations that merge foundational customer files with broader enterprise resource data streams. Synthesizing these separate networks allows analysts to run exhaustive business analytics configurations that evaluate end-to-end organizational efficiency.
Creating a broader view of customers
Enterprise decision-making requires a complete, three-hundred-and-sixty-degree comprehension of the entire consumer relationship. Merging interaction data with external fulfillment matrices reveals the exact relationship between support speed, product reliability, and subsequent contract expansions. Creating this comprehensive customer view empowers account executives to deliver highly customized, premium service.
Breaking down data silos
Deeply entrenched departmental walls severely hinder corporate speed by blocking organic information flow and cross-functional cooperation. When separate business units utilize fragmented personal spreadsheets or disjointed communication software, historical accuracy faces severe degradation. Overcoming this vulnerability demands the implementation of a centralized repository to handle comprehensive cross-functional analysis systematically. Eliminating silos guarantees that separate divisions operate as a synchronized corporate body.
Establishing a single source of insight
Scattering operational documentation across separate cloud storage folders, personal desktops, and email threads damages corporate efficiency. Organizations must centralize all initiative metrics, analytical roadmaps, and tracking logs inside a unified corporate database. Incorporating specialized Enterprise Payroll Software within this centralized system secures employee commission records, workforce labor expenses, and cross-portfolio compensation data seamlessly.
Key CRM Analytics Metrics to Monitor
1. Sales Metrics
Conversion rate:
This foundational indicator measures the exact efficiency of active floor outreach, calculating the percentage of raw prospects that transition into formal paying clients. Monitoring this value across different marketing segments helps identify which customer acquisition loops require immediate optimization.
Win rate:
The win rate measures the total percentage of fully qualified opportunities that sales teams successfully close as won contracts. Tracking this metric helps sales enablement directors check competitive positioning and evaluate the effectiveness of current negotiation tactics.
Average deal size:
Fulfilling annual revenue targets depends on understanding the average fiscal footprint of won contracts across different product tiers. Tracking deal values allows financial directors to evaluate whether the firm is successfully capturing premium enterprise accounts. Incorporating specialized Data Center Security Software within financial transaction nodes safeguards corporate contract values, identity access barriers, and sensitive billing records from digital exploitation.
Sales cycle length:
This metric calculates the exact number of calendar days required to steer a prospect from initial boundary contact through to final sign-off. Compressing the cycle length directly accelerates portfolio velocity and shortens the timeline required to generate returns on capital. Cycle speed remains a primary driver of modern operational throughput.
2. Customer Metrics
Retention:
The retention percentage documents the long-term stability of active client portfolios over set observation windows. Maintaining high retention stability demonstrates that delivered solutions successfully resolve the core operational pain points of the buyer. Exceptional retention performance preserves corporate margins and forms the foundation for predictable revenue scaling.
Customer value:
Calculating the complete lifetime financial contribution of a customer segment allows marketing teams to optimize client acquisition spend metrics. This metric compares historical support expenditures and baseline onboarding costs against aggregate contract revenues systematically.
Engagement:
Digital interaction metrics check how frequently and deeply active client cohorts utilize delivered software or service platforms. Tracking product usage logs, administrative logins, and support desk tickets provides clear insight into actual customer utility parameters. Strong engagement values function as reliable leading indicators for upcoming contract renewals.
Churn indicators:
Identifying hidden warning signs that precede contract cancellations allows proactive retention teams to execute rapid salvage campaigns. Indicators encompass declining platform usage rates, increasing support friction, or prolonged response delays during regular touchpoints. Monitoring these warning signs enables operations leaders to deploy corrective interventions before formal cancellations occur.
3. Pipeline Metrics
Pipeline value:
This metric sums the total potential financial value of all active, open opportunities currently housed within the corporate database. Tracking total pipeline volume helps financial planning departments evaluate whether future pipeline velocity can sustain projected organizational targets. Maintaining an accurate view of pipeline value protects firms from unexpected revenue drops.
Stage conversion:
Stage conversion analytics monitor the precise percentage of deals that advance sequentially through individual milestones of the execution loop. Pinpointing exact locations where pipelines experience systemic slowdowns reveals underlying bottlenecks, such as slow contract generation or delayed procurement reviews. Resolving stage blocks accelerates overall portfolio velocity.
Deal velocity:
Deal velocity measures the speed at which contract opportunities move through the complete sales pipeline to generate realized revenue. This calculation combines total open volumes, standard win percentages, and average cycle durations into a single predictive model. High deal velocity ensures the corporate revenue machine maintains consistent, compounding operational momentum.
Stalled opportunities:
Opportunities that remain completely static inside a single pipeline stage past historical average durations dilute database accuracy. Analysts must isolate these stagnant accounts to prevent sales representatives from wasting valuable billable hours on dead-end prospects. Archiving stalled opportunities keeps active tracking repositories lean and focused entirely on conversion-ready deals.
Turn Analytics Into Better Business Decisions
Identify high-performing channels
Corporate entities must avoid distributing finite marketing budgets evenly across unverified client acquisition avenues. Advanced sales analytics isolate the precise digital channels, professional events, and referral networks that generate premium enterprise contracts. Directing capital exclusively into verified, high-yield acquisition pathways maximizes corporate investment returns significantly. Data-driven channel selection eliminates advertising waste and accelerates organizational growth.
Find weak points in the sales funnel
Every single business infrastructure houses hidden friction points where high-value prospects drop out of the purchasing loop. Systematically tracking milestone completion metrics helps operations leaders pinpoint precise locations where conversion velocity collapses. Identifying these functional vulnerabilities allows for rapid adjustments to copy frameworks, representative response protocols, or contract structures.
Understand customer segments
Relying on generalized marketing messages rarely convinces highly specialized modern enterprise buyers across separate economic verticals. Dissecting consumer data through deep cohort analysis reveals the unique feature preferences, spending limits, and support requirements of distinct client groups. Tailoring corporate communications to these precise parameters ensures outreach captures immediate attention within crowded corporate inboxes.
Improve forecasting
Traditional corporate estimation methods frequently rely on individual representative optimism, leading to major budget errors at year-end. Implementing advanced sales forecasting templates relies on historical conversion metrics, seasonal trends, and active pipeline velocities to calculate future numbers. Grounding future timeline revenue expectations in hard statistical evidence protects scaling firms from unpredictable market corrections.
Allocate resources more effectively
Human capital and material assets represent highly valuable corporate commodities that demand precise, analytical distribution. Understanding which customer segments and regional branches drive premium profit margins allows management to deploy specialized talent dynamically where returns peak. Proper resource optimization prevents employee burnout across core divisions while ensuring secondary background operations do not starve.
Using Dashboards to Make CRM Insights Accessible
What an effective dashboard should show
An elite executive interface must avoid cluttering digital workspaces with vast arrays of disorganized, superficial metrics. Effective CRM dashboards synthesize complex backend data streams into clean, high-impact key performance indicators, showcasing cost, timeline adherence, and variance metrics instantly. The interface should highlight emerging operational risks automatically, enabling supervisors to catch field anomalies without deep data dives.
Role-specific dashboards
Imposing identical data interfaces across distinct corporate tiers creates extreme information confusion and slows execution speed. Executive boards require high-level, macro summaries that visualize long-term corporate health, while front-line managers need granular task views to guide daily activities. Designing specialized, role-specific data configurations guarantees that all personnel monitor information that directly matches their explicit operational deliverables.
Avoiding information overload
Bombarding specialized personnel with excessive rows of raw, unaggregated figures results in severe decision fatigue and operational gridlock. Digital workspace designs must enforce strict boundaries on visual data fields, utilizing hierarchy models to present high-priority trends first.
Making insights easier for teams to act on
Data visualizations serve minimal commercial purpose if front-line personnel cannot interpret the information into immediate field actions. Deployed platforms must pair trend lines with specific, automated recommendations, such as flagging an enterprise account for immediate follow-up when engagement metrics drop. Transforming abstract figures into clear daily directives bridges the historic gap separating analytics from actual floor execution.
Advanced CRM Analytics and Automation
Automated reporting
Manually preparing extensive data summaries wastes valuable analytical hours and introduces substantial human error into corporate records. Modern tracking platforms automate complete data compilation workflows, delivering standardized summaries to stakeholders on predictable chronological cadences. Incorporating specialized Grocery Store POS System architectures within retail environments provides an excellent example of this automation, syncing thousands of daily transactions directly into centralized corporate summaries effortlessly.
Alerts for important changes
Waiting for a monthly review session to discover a major drop-off in a premium enterprise account risks total contract loss. Automated notification engines monitor active databases continuously to flag significant performance shifts, such as an immediate win rate drop or a sudden pipeline stagnation. Triggering instantaneous alerts allows client relationship managers to execute immediate interventions before minor issues transform into formal client turnover.
Predictive insights
The integration of advanced algorithmic work engines allows scaling corporate networks to look beyond historical records and predict future operational parameters. Predictive layers scan active engagement histories to calculate the exact probability of an upcoming contract renewal or isolate hidden churn risks early.
Sales forecasting
Advanced predictive modeling transforms traditional timeline estimation from a guessing routine into a highly rigorous, data-backed discipline. Algorithmic software engines synthesize historical cycle durations, industry conversion speeds, and macro trend adjustments to project future revenue metrics with extreme accuracy. Precise sales forecasting models empower corporate boards to execute extensive infrastructure planning, safe inventory adjustments, and confident hiring cycles.
Automated decision workflows
Modern technological environments allow corporate systems to trigger automated operational workflows the exact moment specific analytical metrics pass predefined thresholds. For instance, when an enterprise account crosses a high engagement score, the platform automatically triggers an expansion proposal workflow for account managers.
Conclusion
Achieving sustainable corporate expansion across complex modern enterprises requires a structured commitment to universal database centralization, precise metric definition, and continuous data evaluation through an active analytical office, standardizing reporting workflows across separate departments, and leveraging advanced tracking technology to confidently overcome execution hazards, optimize operational throughput, and secure lasting industry leadership.
FAQ's
The discipline represents the systematic practice of utilizing data analysis, mathematical modeling, and structured reporting frameworks to evaluate customer data and sales performance metrics across an enterprise.
Centralized consumer information reveals critical buying patterns, historical transaction frequencies, and digital engagement behaviors that directly influence organizational profitability. Analyzing these parameters allows sales enablement teams to tailor messaging to the exact stage of the buyer journey, increasing win rates.
High-performing organizations must monitor a balanced collection of team performance indicators, customer loyalty metrics, and pipeline value parameters. Core metrics encompass sales conversion rates, contract win percentages, average deal sizes, and customer cycle durations.
Advanced data evaluation optimizes commercial execution by pinpointing precise friction points within the active sales funnel, allowing for rapid tactical adjustments.