What Is NPS Software and How Does It Measure Customer Loyalty?
-min.jpg)
A question to customers about their satisfaction rate is usually positive. Is there any chance that someone would write an endorsement without putting his/her personal information on it? The second question is what makes up an organization’s Net Promoter Score; therefore, there should be some way for us to measure that score across many customers so we could get useful information from those responses like warning signs before they become problems. The paper describes calculating this metric; adding features on top of an ordinary questionnaire sheet; and integration within other products from companies like ours. It also covers the weaknesses of metrics, errors made by teams at first stages, and circumstances when an application is better than just being a business need.
What NPS Software Does
The NPS tool is used for conducting surveys automatically. The system asks for a customer’s opinion on an item through this process of recording their score and comment then calculating results which are shown as they change over time. Also better platforms route lower scores to someone that will be able to take action on them because this is where most of their worth lies.
An NPS survey can be conducted through a free form builder and a spreadsheet. Many small companies begin like this. Trouble usually appears within the initial months; there is an accumulation of data at one location while customers' information resides elsewhere but no one links scores back to their accounts. The dedicated software fills this void as it links an answer to its own customers' records along with their timelines.
How NPS Measures Customer Loyalty
The One Question
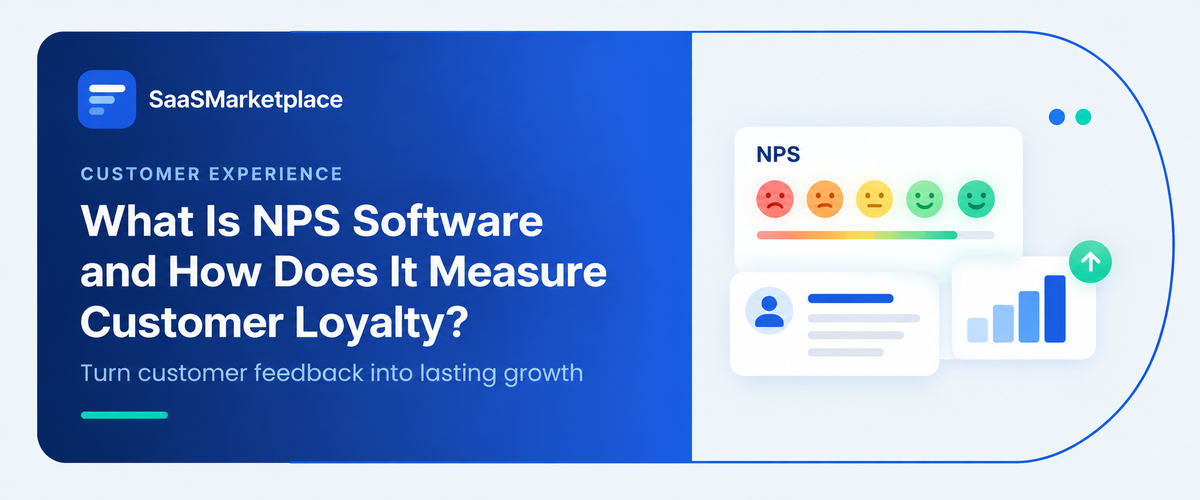
Fred Reicheld created the metric at Bain & Company. The metric asks one simple question to customers: how likely they are to recommend a company to a friend or colleague and rate their responses on a scale from 0 to 10. Additionally, the customer can provide an explanation and give an open-text response.
The reasoning behind the question is that the willingness of a customer to recommend a company is not a measure of satisfaction but an indicator of loyalty. People are generally not prone to expose themselves to the judgment of the public, and therefore a low score signals dangerous intentions, and thus, the company should investigate the causes for such a low mark.
How the Score Is Calculated
Responses can be grouped into three categories. Customers who provide response 9 or 10 are known as promoters. Those who reply with 7 or 8 are called passives and are satisfied with the product, but unlikely to promote it. All other responses (0-6) are classified as detractors.
The result of calculation is scaled from -100 to +100. To calculate the score, percentage of promoters is subtracted from the percentage of detractors. It does not matter what proportion of respondents are passives, but the impact of the result will be closer to zero because the score is based on the total percentage of promoters (including passives) and detractors. Thus, if the percentage of promoters among 100 customers is 50%, while the percentage of detractors is 20%, the score is 30.
To illustrate how to calculate NPS score, a simple example will be provided. If 100 customers have been surveyed, 100 of them responded with a 9 or 10, 60 respondents rated 7 or 8 and 40 customers provided responses from 0 to 6. In this case, the percentage of promoters equals 50% (100/200), while the percentage of detractors is 20% (40/200). Thus, the NPS score is 30 (50-20). Although the score is based on percentages, the result is expressed as a percentage as well.
What Counts as a Good Score
Any number above zero indicates that your promoters outnumber your detractors. Bain has some commonly used benchmarks, with scores above 20 being considered good and anything over 50 as excellent. But there's no real reason to compare yourself to those numbers. Different industries have vastly different typical scores, and a score that's average for a telecommunications company or a bank isn't going to be nearly as impressive when you're looking at software for everyday consumers. Your own score from last quarter would be a much better comparison to aim for, as well as similar companies in your industry.
Types of NPS Surveys and When to Send Them
There are two main types of NPS surveys and practices. Relationship NPS is usually sent periodically (quarterly or every six months) after a customer has established a relationship with the business. It should reflect an overall opinion of the company. Transactional NPS, on the other hand, is sent after a particular interaction – a transaction, support conversation, or onboarding session. It measures the level of satisfaction with this specific interaction.
The evaluation can be distributed via email, in-app popup, SMS, and other channels. Email is the most common type, as it is easily integrated with most marketing platforms. Some companies distribute transactional NPS surveys via email marketing software before switching to a dedicated platform. In-app popup windows have proven to be the most efficient for SaaS products. As for SMS, it is more appropriate for retail and other industries where customers are not primarily desktop users.
Most teams miss one crucial step when scheduling an NPS survey. Surveys should be sent after the customer has experienced something that they can evaluate. If you ask for feedback right after a support interaction, you will measure satisfaction with this particular interaction, not the overall experience. At the same time, scheduling a survey too early (when the client still has not used your product) will yield no feedback, as the customer will not have enough experience yet.
Pro tip: design your survey in a way that it would take no more than 1 minute to complete. Ideally, it should have one question and one open-ended field. A five-question survey will reduce your response rate by 50%, if not more.
Core Features Worth Evaluating
- Survey distribution: Email survey management system for apps and links with a limit per customer contact frequency. Surveys over-survey can be used for turning promoters into detractors quickly.
- Response segmentation: One big number is hidden by many companies. Split data on plans, regions, customers' sizes and products to see which areas have high levels of loyalty while others are declining.
- Closed-loop workflows: If there is no good rating from a reviewer then notify owners about it and check if any follow-up has taken place. Readers who don't take action from scoreboard information are collecting trivia.
- Comment analysis: The open ended answers provide true knowledge. Some tags for topics by themselves save time on large data sets but there is always a need to do manual verification of them.
- Integrations and reporting: The scores will be much better if they're tied up with an organization’s database rather than just being displayed on a screen.
Where NPS Software Fits Among Related Tools
NPS tools sit in the middle of a crowded software landscape, and the overlap confuses many first-time buyers. Each category answers a different question, and scores become far more useful once they flow between systems.
|
Tool category |
Question it answers |
How it works with NPS software |
|
CRM software / online CRM software |
Who is the customer, and what is their deal history? |
Stores each score on the contact record, so sales and account teams see sentiment |
|
What does the customer need fixed? |
Triggers a transactional survey when a ticket closes |
|
|
Is this account likely to renew? |
Uses NPS as one input to the account health score |
|
|
Which message should this customer get next? |
Branches journeys by score: referral asks for promoters, personal outreach for detractors |
|
|
Marketing analytics software |
Which campaigns are working? |
Adds a loyalty view to click and conversion data |
|
How do all these numbers fit together? |
Combines scores with revenue and churn across the company |
Limitations of NPS Worth Knowing
Its greatest advantage to be simple but at the same time a major flaw of this thing. The score indicates your number of supporters vs opponents for a particular issue or topic. No explanation given to it. The number without comments or follow-ups is just a thermometer rather than an actual diagnosis.
Bias of response also exists here. Extreme opinion people tend to be more vocal than others which may cause a bias towards louder voices while ignoring quieter ones from the middle ground. Higher response rate is better than low response rate.
The passive voice is rarely considered when writing an equation because it tends to be easy for them. Some people are not deterred from leaving. Customer lock-in due to annual contracts or difficulty migrating might result in a low score but they will continue to renew, so that NPS does not always reflect behavior.
This is not a useful measure for us. This is an indicator that it needs to be compared against others like customer satisfaction, retention rate and effort rating rather than being a substitute thereof.
Do You Know? NPS and CSAT measure different things. Satisfaction is measured by CSAT for individual interactions whereas Net Promoter Score measures customer loyalty towards an organization as a whole. Despite giving good ratings for their service calls, customers may not be likely to recommend an item.
Common Mistakes Teams Make
- Treating the number as the goal: Once a score becomes a target, people start gaming it, by cherry-picking who gets surveyed or pressuring customers for a 10. A flattering number built that way tells you nothing.
- Surveying without a plan to respond: Customers who take the time to explain a problem and hear nothing back become less likely to answer next time.
- Comparing scores across unlike groups: An enterprise segment and a self-serve segment rarely behave the same way, and blending them can bury useful differences.
- Ignoring sample size: A score based on twenty responses can swing wildly between quarters. Track response counts alongside the score.
- Skipping the data connection: A score disconnected from account and revenue data can't answer the questions leadership will ask. Feeding it into business intelligence software or marketing analytics software fixes most of that.
What to Consider Before Choosing NPS Software
Start with integration. Check that the platform connects to your CRM software, help desk software, and product data, and find out whether the connection is native or depends on third-party tools. Manual exports go stale quickly.
Next, look at survey controls: frequency limits, suppression lists, and branching logic. These protect customers from survey fatigue and protect the quality of your data.
Pricing models differ. Some vendors charge by number of survey responses, others by contacts, and some bundle NPS into a wider customer experience suite. Confirm current pricing directly, because published plans change often and many vendors quote privately.
Consider privacy and data handling. Surveys collect customer names, emails, and free-text comments, so ask where data is stored and how deletion requests are handled, especially if you serve customers in regulated regions.
Finally, test it on a small segment before a full rollout. Send a pilot survey to a few hundred customers, check that responses reach the right records, and see whether your team actually follows up on detractor alerts. A tool that looks impressive in a demo but goes unused in practice is wasted spend.
When NPS Software May Not Be Necessary
Not every business needs a dedicated tool. A company with a few dozen customers can often learn more from direct conversations than from a survey score. Very small samples make the number unstable anyway.
Businesses with one-time purchases and little repeat relationship may find that NPS adds less than product reviews or post-purchase feedback. And if your existing CRM or help desk already includes a survey feature that fits your volume, adding another platform may only create more systems to maintain.
Conclusion
NPS software earns its place when a team wants a consistent read on loyalty and has the capacity to act on what it finds. The score itself is a starting point. The comments, the follow-up calls, and the changes made afterward are what move loyalty.
Before buying, decide who will own the responses, how quickly detractors will hear back, and which systems, such as customer success software or marketing automation software, the scores need to reach. Compare tools against those requirements, then pilot one with real customers. If the results lead to different decisions within a quarter or two, the investment is working.
FAQ's
It is a tool that sends the Net Promoter Score survey, collects responses, calculates the score, and helps teams follow up with customers based on their answers.
Subtract the percentage of detractors, who score 0 to 6, from the percentage of promoters, who score 9 or 10. Passives, who score 7 or 8, count in the total but not in the subtraction.
No. Customer satisfaction usually measures a specific interaction or product, while NPS gauges the broader likelihood that someone would recommend the company.
Many can, at a basic level, including survey sends and score storage. Dedicated platforms usually offer deeper segmentation, theme analysis, and closed-loop follow-up workflows.
Email marketing software can deliver surveys and manage lists, but it typically doesn't track follow-up on detractors or tie scores to account records.